24.03.2014 Showcase
The American National Institute of Standards and Technology (NIST) has just made public an X3DOM version of the Digital Library of Mathemetical Functions (DLMF). VRML content has been successfully migrated to X3DOM, so that every WebGL-capable browser can now be used to inspect high-quality visualizations of mathematical functions from the DLMF.
Here are some starting points to get an impression:
11.03.2014 Uncategorized
At the CeBIT IT fair, which takes place this week in Hannover, Fraunhofer IGD presents another project which is partly based on X3DOM technology.
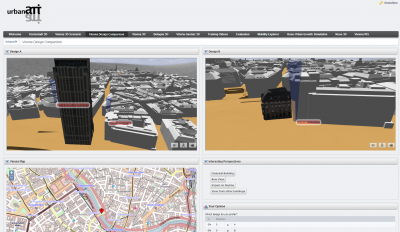
The urbanAPI toolset will allow the fast development and deployment of participative policy support applications for decision support, conflict management, analysis and visualisation. Such developments collectively provide vital decision-making aids for urban planners in the management of the territory, support policy makers for the associated responsibilities in political negotiation, and enable wider stakeholder engagement regarding the future development of the territory. Since the client software is based on standard Web technology, X3DOM serves as an ideal solution for the geospatial 3D visualization components.

You can see the urbanAPI demonstrations at Hall 9, E40, Exhibit 23 (“Geoinformationsmanagement”) by Fraunhofer IGD.
07.03.2014 Uncategorized
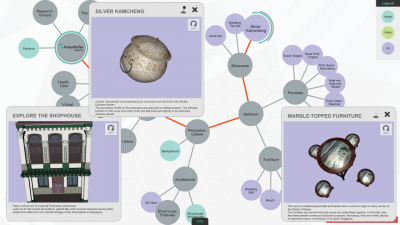
At this year’s CeBIT exhibition, the team from Fraunhofer IGD / Fraunhofer IDM@NTU, Singapore, presents a new, exciting, X3DOM-based prototype for fast, intuitive exploration of information, which is entitled InfoLand. Information is presented on a multi-touch interface through a graphical representation, serving as an information or marketing tool for industry partners and collaborators, researchers, and students. Information is presented in the form of text, images, videos and 3D models, which can be accessed intuitively.

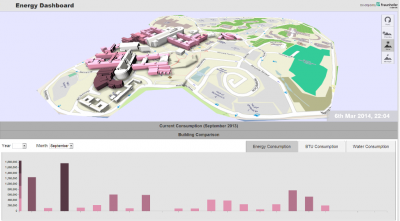
Another prototype visualizes the results of a research project related to energy consumption on the Nanyang Technological University campus in Singapore. Information on various buildings over a selected time span can be translated into concise graphical representations. As decision makers and consumers have increasingly come to expect information to be readily accessible, quickly and at any time, prototypes such as these serve as a tool for consumers to navigate for only pertinent information from a vast database that is translated into clear visuals for easier understanding.

You can see and try the prototypes at Hall 9, E40, Exhibit 23 (“Geoinformationsmanagement”) by Fraunhofer IGD.
06.03.2014 Showcase
Another interesting external Showcase, which combines parametric modelling with dynamic asset management. The IG.Creator from Intelligentgraphics allows creating complex catalog applications with a data-driven design.
|